Open space per person is a key metric to be monitored to evaluate the health of a city. As guidelines of WHO the prescribed open space per person is to be 9 sq.mtrs per person. And as per URDPFI (Urban and Regional Development Plans Formulation and Implementation) guidelines, published 2014, it is recommended to be at 10 to 12 sq.mtrs of open space per person in Indian cities.
As per URDPFI guidelines the ‘open space’ encompasses the following:
- Recreational Spaces, Public parks, gardens and playgrounds
- Organized Green Areas: Designated green belts and landscaped zones.
- Common Open Spaces: Community spaces accessible to the public.
These spaces are intended to be publicly accessible and service purposes such as recreation, leisure and environmental enhancement.
Please keep in mind open space per person differs from open space percentage of total land of a city. While the open space percentage of total land can be higher, open space per person can still be less based on population density.
| City | Per Capita Open Space | Notes |
| Chandigarh | 38 m² | Among the highest in India; over 35% of the city is under forest and tree cover. |
| Gandhinagar | 29.77 m² | Known for its extensive green cover. |
| Delhi | 21.52 m² | High overall, but distribution is uneven; areas like Lutyens’ Delhi have more green space compared to other districts. |
| Nagpur | 17.49 m² | Significant green cover relative to its population. |
| Mysore | 15.25 m² | Maintains a good balance of urban development and green spaces. |
| Chennai | 8.5 m² | While the city’s green cover has improved to 14.9% as of 2018, per capita green space remains below WHO’s recommended 9 m². |
| Mumbai | 1.24 m² | One of the lowest among major cities; efforts are underway to improve this through revised development plans. |
| Bangalore | 1.9 m² | Per capita open space has declined over the years due to rapid urbanization. |
| Hyderabad | 0.93 m² | Limited green spaces in proportion to its population. |
| Kanpur | 3.76 m² | Below the national average, indicating a need for more green spaces. |
| Trivandrum | 0.55 m² | Among the lowest, highlighting a significant shortfall in accessible green areas. |
To give you a useful comparison of open space per person in different cities, here’s a snapshot of some global cities based on available public/open green space (like parks, gardens, and recreational areas) per capita, typically measured in square meters per person:
| City, Country | Open Space Per Person (approx.) |
| Vienna, Austria | 120 m²/person |
| Oslo, Norway | 88 m²/person |
| Sydney, Australia | 74 m²/person |
| Singapore | 66 m²/person |
| London, UK | 45 m²/person |
| New York City, USA | 23 m²/person |
| Tokyo, Japan | 5.8 m²/person |
| Mumbai, India | 1.1 m²/person |
| Cairo, Egypt | 0.9 m²/person |
| Dhaka, Bangladesh | 0.5 m²/person |
These numbers are estimates and can vary depending on how “open space” is defined (e.g., including private gardens, accessibility, urban vs. metro regions).
In the context of the table above, “open space per person” generally refers to:
Definition of Open Space Considered:
1. Publicly Accessible Green Spaces:
- Parks
- Public gardens
- Urban forests
- Recreational areas
- Riverbanks and waterfront promenades
2. Playgrounds & Sports Fields:
- Public sports facilities
- Playgrounds within residential areas
3. Natural or Semi-Natural Areas within City Limits:
- Hills, forests, wetlands, or protected areas that are accessible to the public
- What’s Usually Not Included:
- Private gardens or lawns
- Golf courses (unless publicly accessible)
- Rooftop green areas (unless open to the public)
- Agricultural land
- Roads and sidewalks (unless part of green infrastructure)
So when we say “open space per person,” it typically focuses on urban public green space available to all residents for recreation and leisure.
To increase open space per person in a city, urban planners and policymakers can adopt a variety of strategies. This involves creating new open spaces, optimizing land use, and improving access to existing open areas. Below are key strategies along with reference materials:
Strategies to Increase Open Space per Person
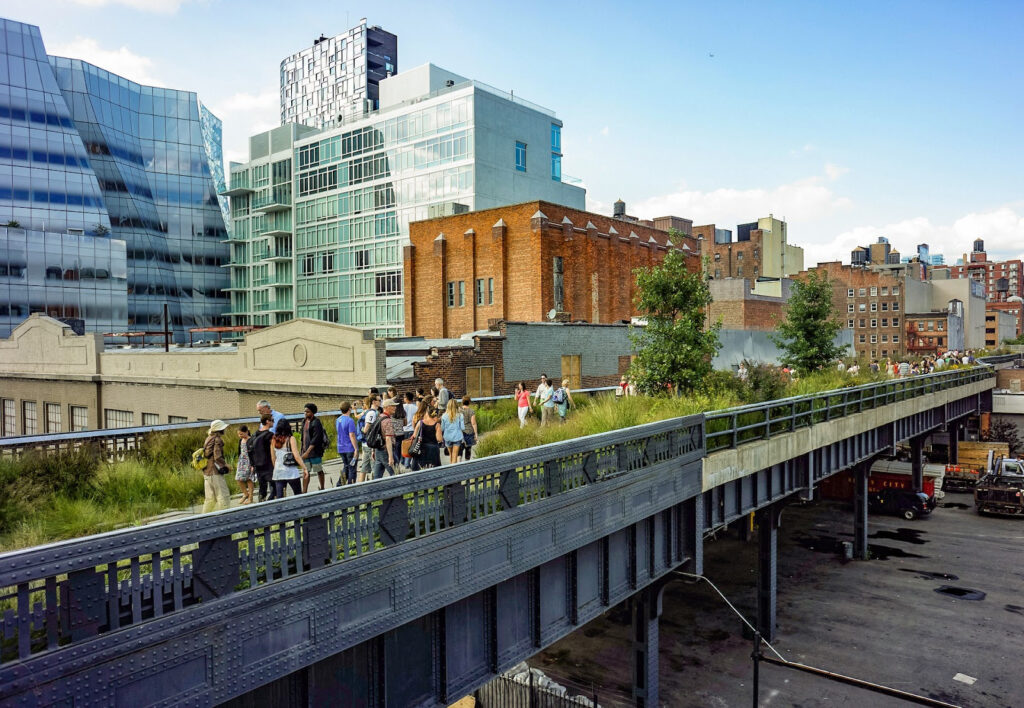
1. Redevelop Underutilized Land
Convert vacant lots, brownfields, and unused government land into parks and public open spaces.
Example: The High Line in New York City, transformed from an abandoned railway into a public park.
Reference:
Urban Land Institute (ULI). “Reclaiming Brownfields: Turning Problem Properties into Community Assets.”
Home
2. Incorporate Open Space in Urban Redevelopment Plans
Mandate inclusion of parks, green roofs, or communal courtyards in housing and commercial projects.
Include minimum green space requirements in zoning laws.
Reference:
UN-Habitat. “Streets as Public Spaces and Drivers of Urban Prosperity” (2013).
3. Promote Vertical and Multifunctional Green Infrastructure
Encourage green roofs, vertical gardens, and rooftop parks, especially in high-density areas.
The Potomac River Waterfront Park in Maryland
image: courtesy of the Maryland-National Capital Park and Planning Commission
Reference:
World Bank. “Integrating Green and Gray – Creating Next Generation Infrastructure” (2019).
4. Reclaim Streets for People
Implement car-free zones or convert excess roadways into pedestrian-only green spaces.
Reference:
Gehl Architects. “Cities for People” by Jan Gehl (2010).
ISBN: 978-1597265737
5. Enforce Population Density Guidelines Linked to Green Space
Establish a target such as the WHO standard: at least 9 m² of green space per person, with a desirable value of 50 m² per person.
Reference:
World Health Organization (WHO). “Urban Green Spaces and Health – A Review of Evidence” (2016).
6. Community Participation and Land Trusts
Support local initiatives for community gardens or land trusts to secure open space access.
Reference:
American Planning Association (APA). “Green Infrastructure: A Landscape Approach”
7. Use Land Value Capture Mechanisms
Fund green space creation through developer contributions or land value tax where development increases property values.
Reference:
Lincoln Institute of Land Policy. “Land Value Capture: Tools to Finance Urban Infrastructure and Development”