A research-grade breakdown of how GCC mall operators earn — and lose — money. Covers all revenue streams including parking, the key drivers that amplify NOI, and the structural risks that erode it. Companion financial model available for download.
Executive Summary
Retail real estate is one of the most operationally complex asset classes in the built environment. A mall is not simply a collection of shops — it is a carefully engineered economic ecosystem where landlord revenue, tenant performance, footfall management, and experience design are deeply interconnected. In the GCC, where retail is both a cultural institution and an infrastructure-grade investment, understanding how a mall operator earns — and loses — money is essential for developers, investors, asset managers, and built environment professionals.
This article dissects the full revenue architecture of a GCC mall operator: the income streams that drive returns, the operational levers that amplify them, and the structural risks that erode NOI. A companion financial model benchmarks both a 50,000 sq.ft community mall and a 1,00,000 sq.ft regional mall across a five-year projection. For a deeper look at how malls are designed and what they cost to build in the UAE, see our detailed article: Mall Design Principles and Cost — A Developer’s Perspective.
The GCC Mall as an Economic Institution
In most global markets, malls have faced sustained headwinds from e-commerce, changing consumer behaviour, and the rise of mixed-use urban formats. The GCC tells a different story. Dubai, Riyadh, Doha, and Abu Dhabi continue to develop and sustain super-regional malls with strong occupancy, driven by four structural factors:
- Tourism infrastructure — Dubai Mall alone hosts 80–100 million visitors annually, far exceeding many national airports in throughput.
- Climate — outdoor retail is non-functional for 6–8 months of the year across most of the Gulf, making enclosed malls structurally necessary rather than merely convenient.
- Entertainment deficit — in many GCC cities, malls are the primary social and entertainment infrastructure, a role that is difficult to displace digitally.
- Urban density patterns — car-dependent urban morphology concentrates consumer spend into mall nodes rather than distributing it across high-street corridors.
These structural conditions create a higher baseline for mall viability in the GCC than in comparable Western markets. They also mean that the revenue destruction factors are distinct — they tend to be managerial and structural rather than existential. According to the International Council of Shopping Centers (ICSC), retail real estate fundamentals globally have strengthened considerably through 2024–25, with vacancy rates at multi-year lows and institutional capital returning to the sector at scale.
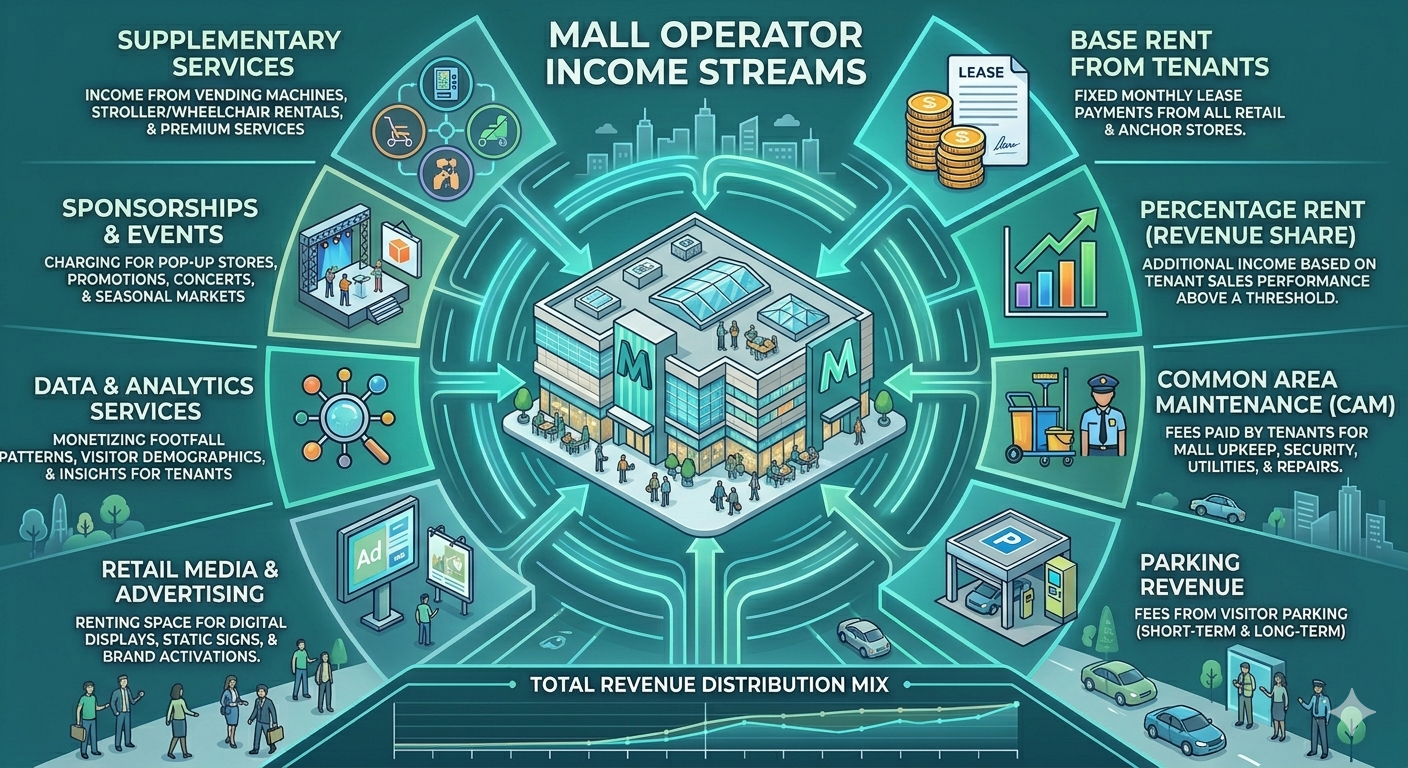
How a Mall Operator Earns Money: The Full Revenue Architecture
1. Base Rent — The Core Income Engine
Base rent is the minimum guaranteed income paid by tenants per square metre per year, irrespective of their sales performance. It is the foundation of the P&L and the primary driver of Net Operating Income (NOI).
In the GCC, rent is typically quoted in AED or SAR per sq.m per year and varies significantly by zone and tenant category:
| Tenant Category | Typical Rent (AED/sq.m/yr) | Role in Mall Ecosystem |
|---|---|---|
| Anchor — Hypermarket / Dept. Store | 60 – 120 | Footfall generator; subsidised rate |
| Anchor — Cineplex / Entertainment | 100 – 160 | Dwell-time extender; below-market |
| Specialty Retail — Fashion | 180 – 280 | Primary revenue per sqm contributor |
| F&B — QSR & Casual Dining | 220 – 320 | High yield; drives repeat visits |
| F&B — Fine Dining | 180 – 260 | Positioning asset; evening activation |
| Services — Gym / Clinics | 100 – 180 | Tenancy diversifier; lower yield |
| Luxury Retail | 300 – 600+ | Brand positioning; premium per sqm |
The key strategic insight is that anchor tenants — hypermarkets, cinema chains, and department stores that drive footfall — are deliberately subsidised. They pay below-market rents in exchange for the traffic they generate, which in turn justifies the premium rates charged to specialty and F&B tenants. The entire rent model is a cross-subsidy structure.
Shifting 5% of GLA from anchor to specialty retail or F&B can increase blended rent per sq.m by 30–60%. This is the single highest-impact revenue lever available to a mall operator.
2. Turnover Rent — Aligning Landlord and Tenant Incentives
Turnover rent (also called percentage rent) is payable when a tenant’s gross sales exceed a pre-agreed natural breakpoint — typically base rent divided by a standard sales-to-rent ratio of around 10%. Once exceeded, the landlord earns 5–10% of turnover above that threshold.
Turnover rent is more prevalent in mature Western markets but is growing in GCC leases, particularly for F&B and entertainment operators. For a stabilised mall with strong tenants, turnover rent typically adds 5–10% on top of base rent income.
3. CAM Recovery — Recouping the Cost of Shared Infrastructure
Common Area Maintenance (CAM) charges are a proportionate pass-through of the costs associated with operating shared spaces — cooling, lighting, security, cleaning, landscaping, and vertical transport. In GCC malls, CAM rates typically run at AED 60–100 per sq.m per year on occupied space.
CAM is technically a cost recovery mechanism, not a profit centre. However, operators with efficient FM procurement can generate a modest net margin on CAM collections — recovering more from tenants than the actual cost of services.
4. Specialty Leasing — The High-Margin Common Area Income
Specialty leasing refers to the commercialisation of non-GLA space — walkway kiosks, cart vendors, ATM placements, vending machines, digital advertising screens, and pop-up activations. This income is structurally high-margin because the space has no direct occupancy cost.
For a 50,000 sq.ft community mall, specialty leasing income might range from AED 500,000–800,000 annually. For a regional mall exceeding 1,00,000 sq.ft, AED 1.2–2.5 million is achievable depending on footfall quality, digital screen infrastructure, and activation programming. ICSC research on ancillary income confirms that specialty and media income has grown from a nominal NOI contributor to a material line item at well-managed centres globally, with digital screen networks in particular driving outsized returns.
5. Events, Brand Activations & Sponsorships
Atriums, grand courts, and external facades are increasingly valuable brand canvases. Major consumer brands — automotive, fashion, consumer electronics — pay for exclusive seasonal activations, product launches, and experiential marketing campaigns. In flagship GCC malls, this revenue stream has grown materially as experiential retail has become the dominant investment thesis.
6. Parking Revenue — Underutilised but Evolving
Parking is one of the most misunderstood revenue lines in GCC mall economics. In the majority of Gulf markets, parking is free — a structural competitive norm driven by car-dependent urban form, municipal planning requirements, and the risk of footfall migration to free alternatives. This makes parking a cost centre in most GCC malls, not a profit centre.
However, the picture is more nuanced than a binary free/paid distinction. Several parking-related revenue streams are viable and growing across the region:
- Valet parking — a premium paid service common at flagship Dubai and Riyadh malls, typically priced at AED 20–35 per visit. Well-managed valet operations at high-traffic malls can generate AED 1–3 million annually.
- EV charging bays — as EV adoption accelerates across the GCC (penetration doubled from 2% to roughly 4% in 2024 according to Roland Berger’s EV Charging Index 2025), dedicated charging bays are transitioning from amenity to revenue asset. Operators charge per kWh or per hour, with premium covered bays commanding a mark-up. Research published in Applied Energy (2025) found that transitioning mall parking lots to EV charging hubs can increase annual profit by up to 34% on the parking asset itself.
- Monthly / seasonal passes — sold to workers in adjacent offices or residents in mixed-use developments, generating reliable recurring income independent of daily footfall.
- Reserved premium bays — covered, closer-to-entrance, or guaranteed spaces sold at a premium above standard free parking, particularly relevant in extreme summer heat conditions.
- Advertising on parking structures — façade wraps, entry signage, and in-structure digital panels sold to brand advertisers.
The GCC Parking Management Market is projected to grow from USD 1.15 billion in 2025 to USD 2.34 billion by 2031 at a CAGR of 12.1%, driven by smart city programs, IoT-enabled occupancy systems, and automated fee collection. As GCC cities densify — particularly with Riyadh Metro expansion and Dubai’s ongoing transit investments — the structural case for paid parking in prime locations will strengthen over the coming decade.
For now, operators should model parking as a cost centre in base case projections, but treat valet, EV charging, and premium bays as upside revenue opportunities worth active development.
7. Property Management Fees
Operators who manage malls they do not own earn a management fee — typically 2–5% of Gross Rental Income — plus performance bonuses tied to occupancy and NOI targets. This structure separates the asset-light operating business from the capital-intensive ownership model and is common in institutional mall portfolios across the GCC.
What Increases Mall Operator Revenue: The Key Drivers
| Revenue Driver | Mechanism | Impact |
|---|---|---|
| ⬆ Higher occupancy rate | More sq.m generating rent income | Very High |
| ⬆ Better tenant mix (more F&B / specialty) | Lifts blended rent per sq.m by 30–60% | Very High |
| ⬆ Stronger footfall quality & volume | Justifies rent escalations at renewal | High |
| ⬆ Tenant sales performance | Unlocks turnover rent above breakpoint | Medium–High |
| ⬆ Specialty leasing activation | More kiosks, screens, brand campaigns | Medium |
| ⬆ Entertainment & F&B depth | Extends dwell time → higher spend per visit | Medium–High |
| ⬆ Valet & EV charging monetisation | Converts parking from cost to revenue asset | Low–Medium (growing) |
| ⬆ Staggered lease expiry profile | Reduces vacancy risk; enables rent steps | Medium |
| ⬆ Anchor tenant quality | Brand-pull effect on specialty occupancy | Medium |
| ⬆ Digital advertising inventory | Direct revenue from screen networks | Low–Medium |
| ⬆ Mixed-use adjacency (hotel / office / resi) | Drives captive, recurring consumer spend | Medium |
Occupancy Is the Master Variable
No other lever matters more than occupancy. A mall generating AED 200 per sq.m/yr at 92% occupancy outperforms one at AED 240/sq.m at 70% occupancy. Occupancy is the multiplier that converts rent potential into actual income — and it is the primary metric investors and lenders scrutinise.
The GCC benchmark for a stabilised, well-managed community mall is 88–92% occupancy. Super-regionals in prime locations sustain 95%+ through active tenant management and waitlists.
Tenant Mix is the Rent Optimisation Tool
The most impactful revenue repositioning available to an existing mall operator is tenant mix rebalancing. Replacing an underperforming anchor with a high-street F&B cluster, or converting a dark department store to an entertainment anchor with associated specialty retail, routinely delivers 20–40% NOI uplift — without adding a single square metre of GLA.
What Reduces Mall Operator Revenue: The Value Destroyers
| Risk Factor | Mechanism | Impact |
|---|---|---|
| ⬇ Vacancy / dark space | Zero rent; continued FM cost on dead space | Very High |
| ⬇ Anchor tenant failure or departure | Removes footfall driver; cascades to specialty vacancies | Very High |
| ⬇ Tenant insolvency | Rent arrears; void costs; fit-out write-offs | High |
| ⬇ Over-supply in catchment | Rental pressure; poaching of tenants by competitors | High |
| ⬇ Rent-free periods & incentives | Short-term income erosion to secure tenancies | Medium |
| ⬇ Deferred maintenance | Deteriorating NLA quality; affects tenant retention | Medium–High |
| ⬇ Poor FM procurement | CAM costs exceed recovery; margin compression | Medium |
| ⬇ E-commerce substitution | Reduces footfall → weakens renewals | Medium (GCC: lower risk) |
| ⬇ Macro downturn | Consumer spend contraction → turnover rent nil | Medium |
| ⬇ Weak brand positioning | Unable to attract premium tenants; rent ceiling suppressed | Medium |
Vacancy is the Structural Threat
Dark space — unleased or effectively unused GLA — is the most destructive force in a mall P&L. It creates a dual problem: zero rental income on the void space, combined with continued FM, insurance, and overhead costs allocated to it. At the same time, dark units reduce the perceived vibrancy of the mall, suppressing footfall and weakening the operator’s negotiating position at lease renewals.
In the GCC, structural vacancy can emerge from anchor tenant failure (department stores have been the most vulnerable globally), over-supply in secondary catchments, or mismatched tenant formats. The correction requires active asset management — reconfigurations, temporary activations, and strategic rent concessions to maintain physical occupancy.
Over-Supply Risk in Emerging GCC Markets
Saudi Arabia’s Vision 2030 retail development pipeline, while strategically necessary, introduces localised over-supply risk in some secondary cities. Operators entering new markets need to model retail GLA per capita against income benchmarks — a metric that separates sustainable mall development from speculative construction.
A mall where a single anchor accounts for more than 30% of visitor footfall carries significant concentration risk. The departure of that anchor can reduce mall-wide footfall by 20–40%, with cascading effects on specialty rent renewals.
Financial Model Benchmarks: 50,000 vs. 1,00,000 Sq.Ft
The Green Arch World GCC Mall Financial Model projects five-year performance for both a community mall (50,000 sq.ft) and a regional mall (1,00,000 sq.ft) under GCC market assumptions. Key stabilised-year outputs are summarised below:
| Metric | Community Mall (50K sq.ft) | Regional Mall (1,00,000 sq.ft) |
|---|---|---|
| GLA (sq.m) | 4,645 sq.m | 9,290 sq.m |
| Stabilised Occupancy (Year 4) | 92% | 92% |
| Gross Rental Income (Year 4) | ~AED 7.2M | ~AED 13.8M |
| Effective Gross Income (Year 4) | ~AED 9.1M | ~AED 17.2M |
| Total Operating Expenses (Year 4) | ~AED 2.3M | ~AED 4.2M |
| Net Operating Income (Year 4) | ~AED 6.8M | ~AED 13.0M |
| NOI Margin | ~75% | ~76% |
| Implied Asset Value @ 8% Cap Rate | ~AED 85M | ~AED 163M |
| Development Cost Assumed | AED 55M | AED 105M |
| Cash-on-Cash Return (Year 4, 55% LTV) | ~18–22% | ~19–23% |
The scale effect is visible but modest at this size range — NOI margins are broadly comparable at around 75–76%. The more significant differentiator is risk profile: a 1,00,000 sq.ft mall requires a more diversified anchor strategy and a deeper F&B and entertainment offering to sustain occupancy, but also commands a lower cap rate from institutional investors due to its income scale and liquidity.
Conclusion: Malls as Infrastructure, Not Just Retail
The most enduring lesson from GCC mall economics is that the best-performing assets are managed as infrastructure — long-term, operationally intensive, and fundamentally linked to the urban and social fabric around them. Revenue is not a passive outcome of leasing space; it is the result of active curation: of the tenant mix, the experience offer, the CAM efficiency, and the brand positioning of the mall itself.
For built environment professionals advising on retail development, the financial model logic matters as much as the design logic. A 5% improvement in blended rent per sq.m, or a 3-point improvement in occupancy, can shift NOI by 15–25% — and with it, the implied asset value by tens of millions of dirhams. Even a relatively nascent revenue line like EV charging or valet parking, properly structured, can add AED 1–3 million annually to a well-located mall’s top line.
The companion financial model for this article — covering both 50,000 sq.ft and 1,00,000 sq.ft GCC malls across a five-year projection — is available as a downloadable Excel tool from Green Arch World.
Further Reading & References
- Mall Design Principles and Cost — A Developer’s Perspective — Green Arch World
- Ancillary Income: From Phantom Income to NOI — ICSC
- Money Is Moving Again in Retail Real Estate — ICSC (2025)
- EV Charging Index 2025: GCC Region Insights — Roland Berger
- Transition from Mall Parking Lots to EV Charging Stations — Applied Energy, ScienceDirect (2025)
- GCC Parking Management Market Forecast 2025–2031 — Mobility Foresights
- Boosting Mall Income — ICSC Shopping Center Today
Disclaimer: This article is for informational and educational purposes only. It does not constitute investment, legal, or financial advice. All figures are indicative based on market research and benchmarks available at time of publication. Green Arch World — greenarchworld.com